Dashboard and BI Analytics in Chatswood, Sydney, Lakemba,
Lane Cove, NSW
Dashboards & BI Analytics offer potent visualizations and
insights, fueling data-driven choices and facilitating a
comprehensive business performance view.
Contact Us:
adeel@digipm.com.au
What is a Dashboard?
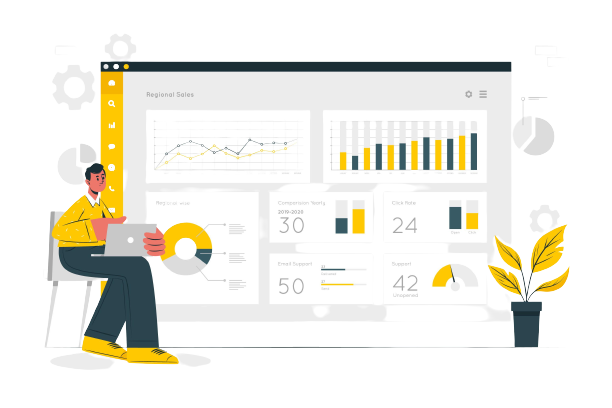
A dashboard is a user interface that displays summarized and visualized data in a consolidated manner. It provides a real-time snapshot of an organization's performance and enables users to monitor and analyze data trends, metrics, and KPIs in a single view. Dashboards are designed to be highly intuitive, interactive, and customizable, allowing users to quickly identify patterns, trends, and anomalies, and make informed decisions.
Dashboard and BI Analytics
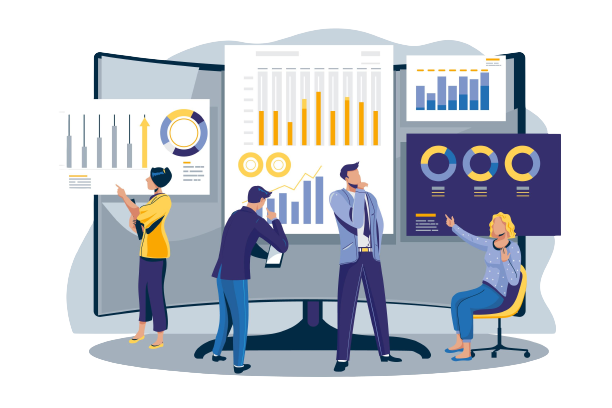
Dashboard and Business Intelligence (BI) Analytics are essential components of modern data-driven decision-making processes. They provide organizations with valuable insights by transforming raw data into meaningful and visually appealing information, facilitating efficient monitoring, analysis, and reporting of key performance indicators (KPIs) and metrics.
Dashboard Best Practices
- Define Clear Objectives: Clearly define the purpose and objectives of your dashboard to ensure it aligns with your business goals and user requirements.
- Choose Relevant Metrics:Select key metrics and performance indicators that directly impact your business objectives and provide actionable insights.
- Keep it Simple and Intuitive: Design your dashboard with a clean and intuitive layout, avoiding clutter and unnecessary visual elements. Use clear labels, headings, and tooltips to enhance user understanding.
- Use Visualizations Effectively: Select appropriate visualizations that effectively communicate the data and insights. Use charts, graphs, and other visual elements to highlight patterns, trends, and comparisons.
- Ensure Data Accuracy and Consistency: Validate and cleanse your data to ensure accuracy and consistency. Perform regular data quality checks and ensure data sources are reliable and up-to-date.
- Foster Interactivity and Customization: Allow users to interact with the dashboard by applying filters, selecting time periods, and customizing views. This empowers users to explore data and derive insights based on their specific needs.
- Consider Responsive Design: Ensure your dashboard is responsive and optimized for different devices and screen sizes, allowing users to access and view it on desktops, laptops, tablets, and mobile devices.
- Regularly Update and Maintain: Keep your dashboard up-to-date with fresh data and regularly review its relevance to changing business needs. Maintain and enhance the dashboard based on user feedback and evolving requirements.

Business Intelligence (BI) Analytics
- Data Extraction and Integration: BI Analytics involves extracting data from multiple sources, such as databases, spreadsheets, and cloud-based applications. The data is then integrated and transformed into a unified format suitable for analysis.
- Data Warehousing and Data Lakes: Organizations often employ data warehousing techniques to store and manage large volumes of structured and semi-structured data. Data lakes provide a more flexible and scalable approach to store and analyze both structured and unstructured data.
- Advanced Analytics Techniques: BI Analytics utilizes advanced techniques such as data mining, predictive modeling, machine learning, and natural language processing to uncover hidden patterns, predict future trends, and gain deeper insights from the data.
- Self-Service BI: Self-service BI empowers business users to perform data analysis and generate reports and insights without heavy reliance on IT or data analysts. It provides user-friendly tools and interfaces that allow non-technical users to explore data and create visualizations.
- Data Governance and Security: Data governance ensures data quality, integrity, and compliance with regulations. It establishes policies, processes, and controls to manage data effectively and maintain data security and privacy.
- Collaboration and Sharing: BI Analytics platforms often provide features for collaboration, allowing users to share insights, reports, and dashboards with colleagues and stakeholders. This fosters a culture of data-driven decision-making across the organization.